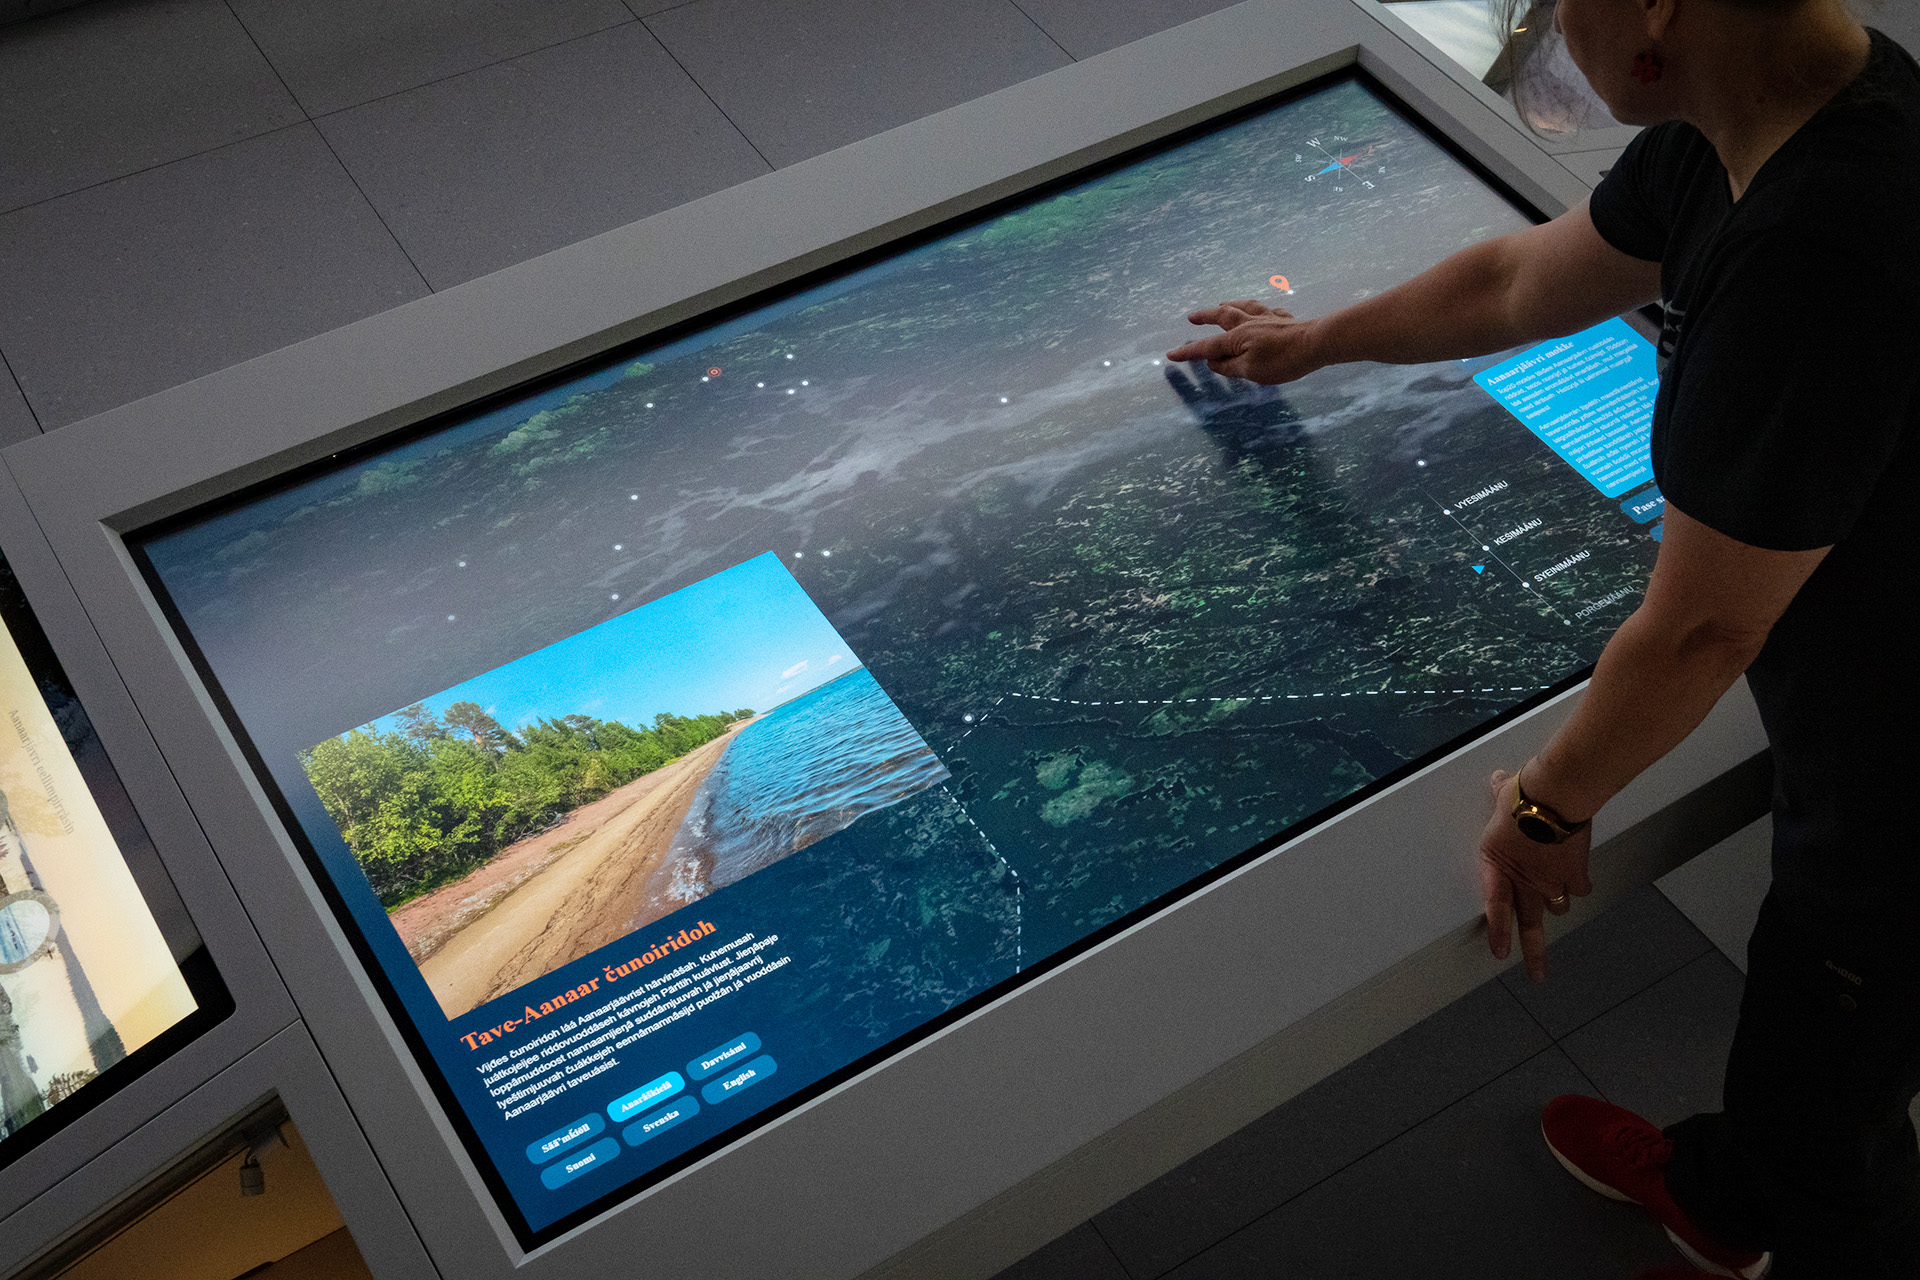
Interactive lake Inari map for Sámi Museum Siida
Siida's permanent exhibition tells the story of the interaction between nature, people and culture in the Sámi homeland. The interactive media we built for the museum is entirely data-driven, bringing Inarijärvi lake and its surroundings to life through six map layers — each one revealing a different dimension of the lake's nature, history and living culture.
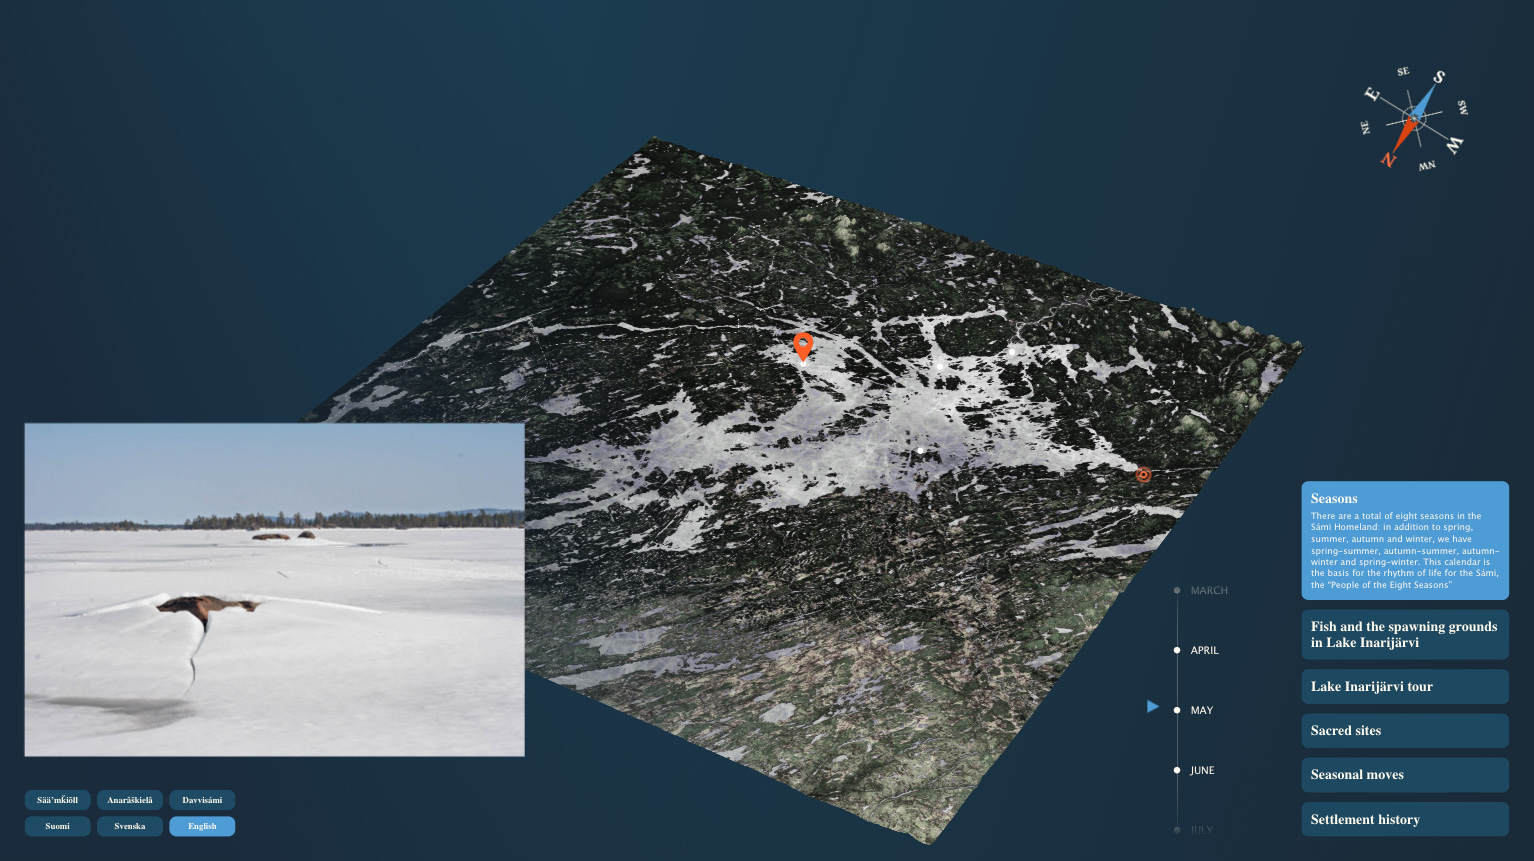
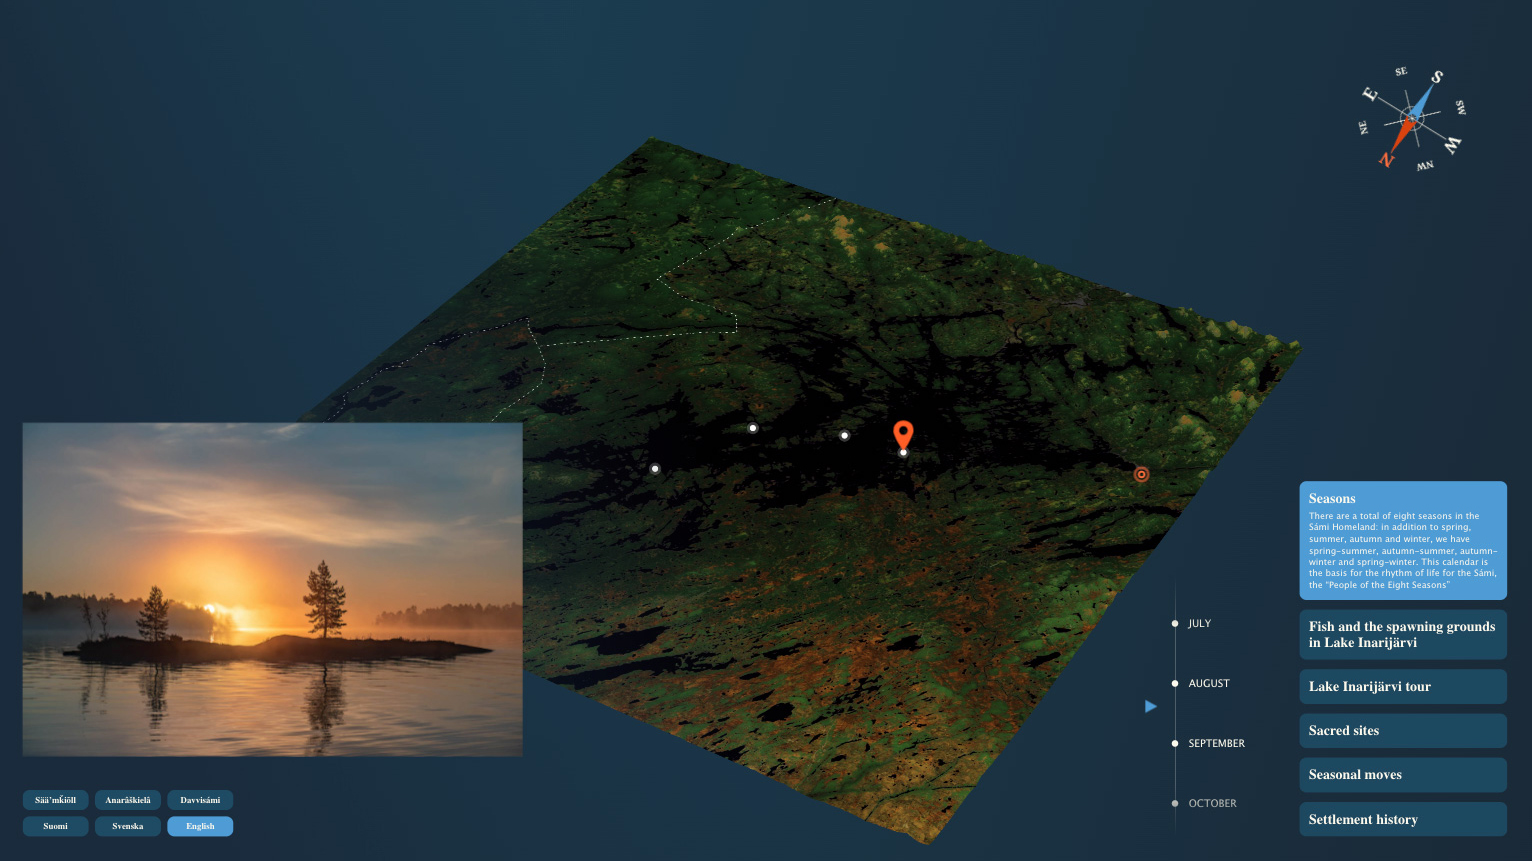
Seasons traces the eight-season calendar that forms the backbone of Sámi life: beyond the familiar four seasons, the Sámi homeland has spring-summer, autumn-summer, autumn-winter and spring-winter — a rhythm that has shaped everything from reindeer herding to fishing for generations.
Fish and spawning grounds maps how water level regulation for electricity production in Russia and Norway has changed the lake's ecosystem, particularly for autumn-spawning species like arctic char and trout, while also showing how climate change is pushing pike and perch further north.
Lake Inarijärvi tour guides visitors through twenty points of interest along the lake's rugged shores — from a Viking-age silver hoard and a WWII prison camp island to ancient pine groves and the lake's deepest point at 92 metres.
Sacred sites charts the seidas, sacrificial islands and sacred landscapes that reflect the Sámi worldview, in which everything in nature carries a soul — including the island of Äijih, a place of offering to the thunder god visited since the 14th century.
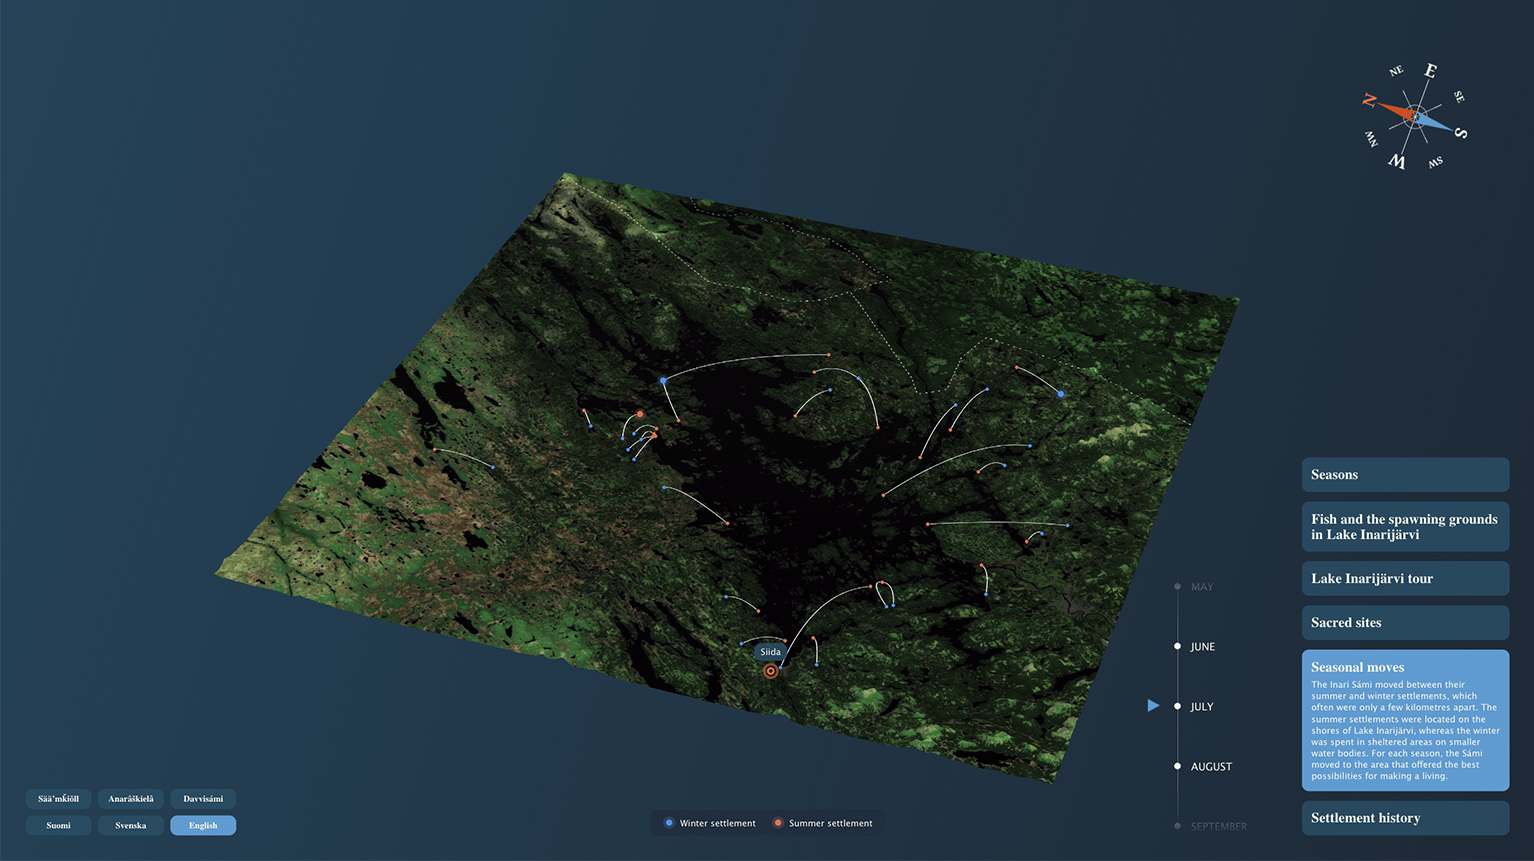
Seasonal moves follows the annual movement of Inari Sámi families between their summer settlements on the lake's shores and sheltered winter villages inland, tracing the routes and stopping points that defined life on the lake.
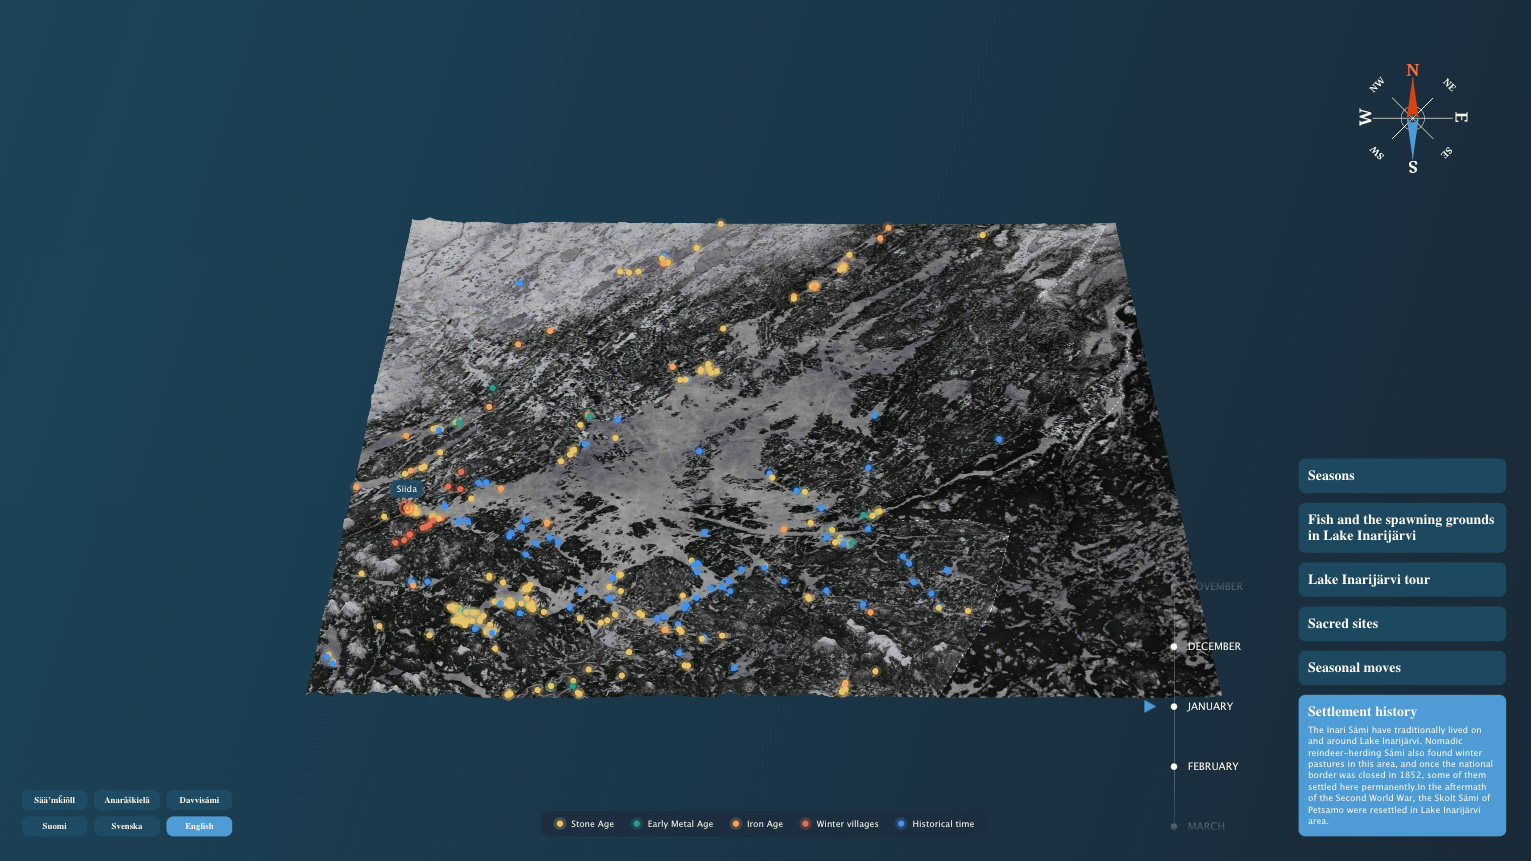
Settlement history spans 10,000 years of habitation — from Stone Age settlements at the mouth of the Juutuanjoki river through Iron Age rectangular hearths to the winter village era and the resettlement of the Skolt Sámi after World War II.
Building Lake Inari's 3D Map Entirely From Data
We set one non-negotiable technical constraint to this project: every visual element on the map had to originate from a structured datasource. Nothing would be hand-painted, retouched, or faked in an image editor. If it appears on the map — terrain, forest cover, water depth, ice extent — it traces back to a real dataset with real coordinates.
This wasn't an aesthetic choice. It was a production decision. A databased pipeline means the map can be regenerated, updated when new data becomes available, and queried — every pixel carries meaning beyond its colour value.
The 3D basemap needed to represent geology, elevation, and the bathymetry of Lake Inari simultaneously. That required layering multiple independent datasources into a single coherent scene.
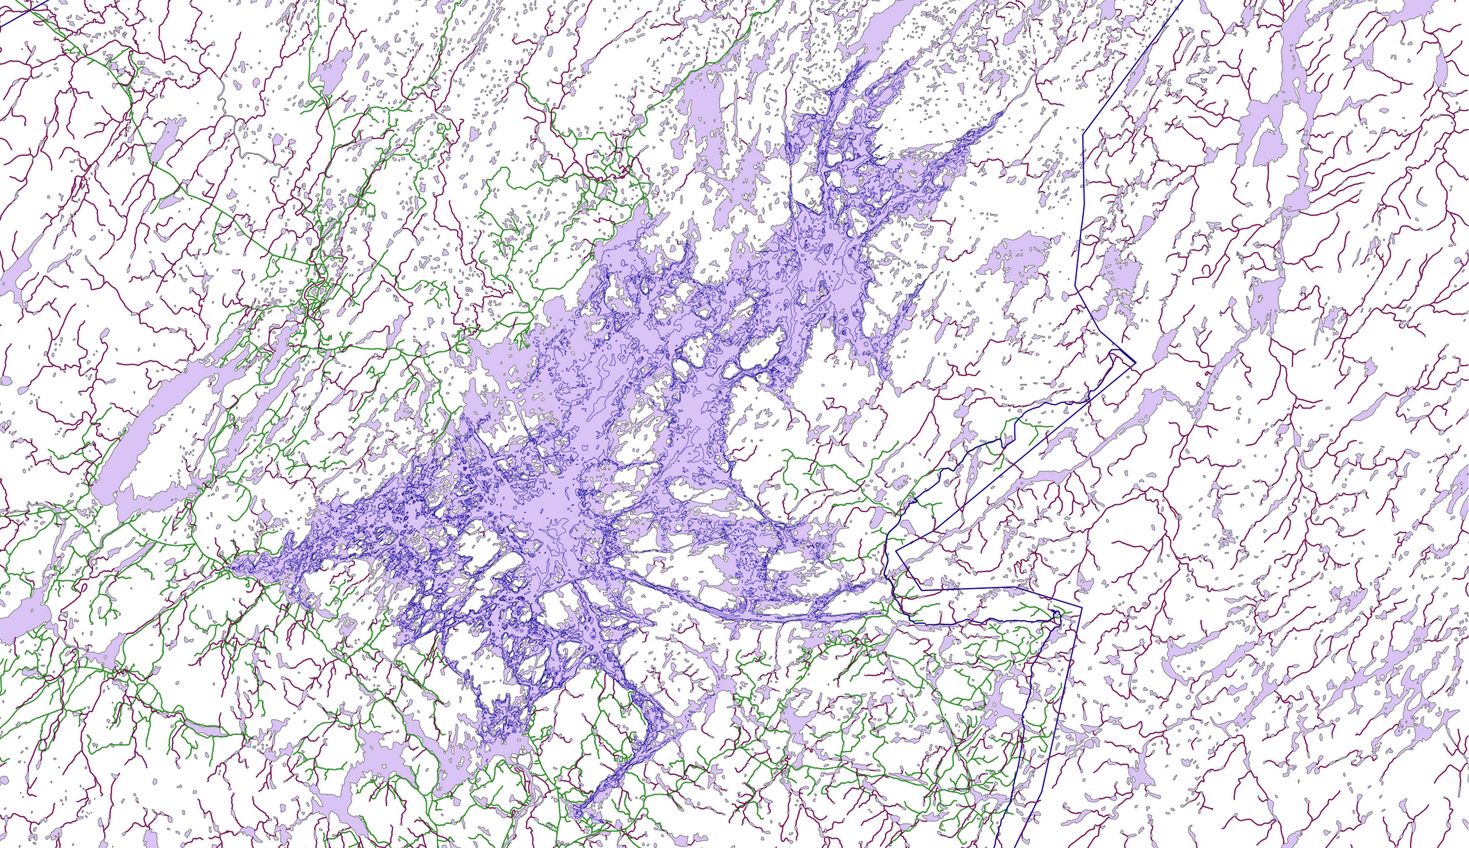
The foundation is a Digital Elevation Model (DEM) at 10-metre resolution, combined with a GIS dataset of depth curves for the lake bed. The depth data — the same source used for traditional hydrographic chart exports — was ingested as vector polygons, giving us precise contour geometry for the underwater terrain. Together, these two datasets define every surface the camera can see: land rises from the DEM, the lakebed drops away from the bathymetric polygons.
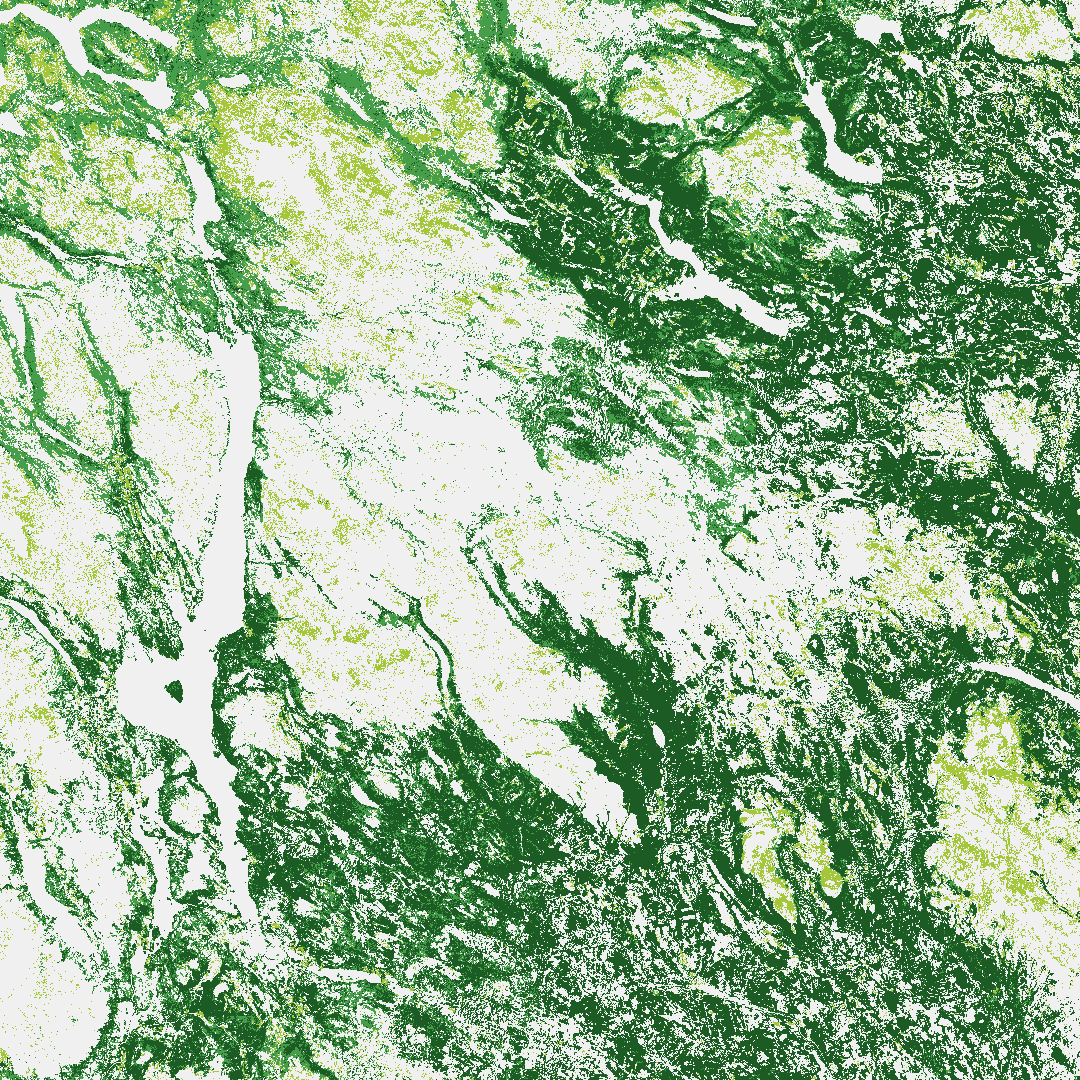
Rather than painting land cover by hand, we sourced two layers from the Copernicus Land Monitoring Service's Layers:
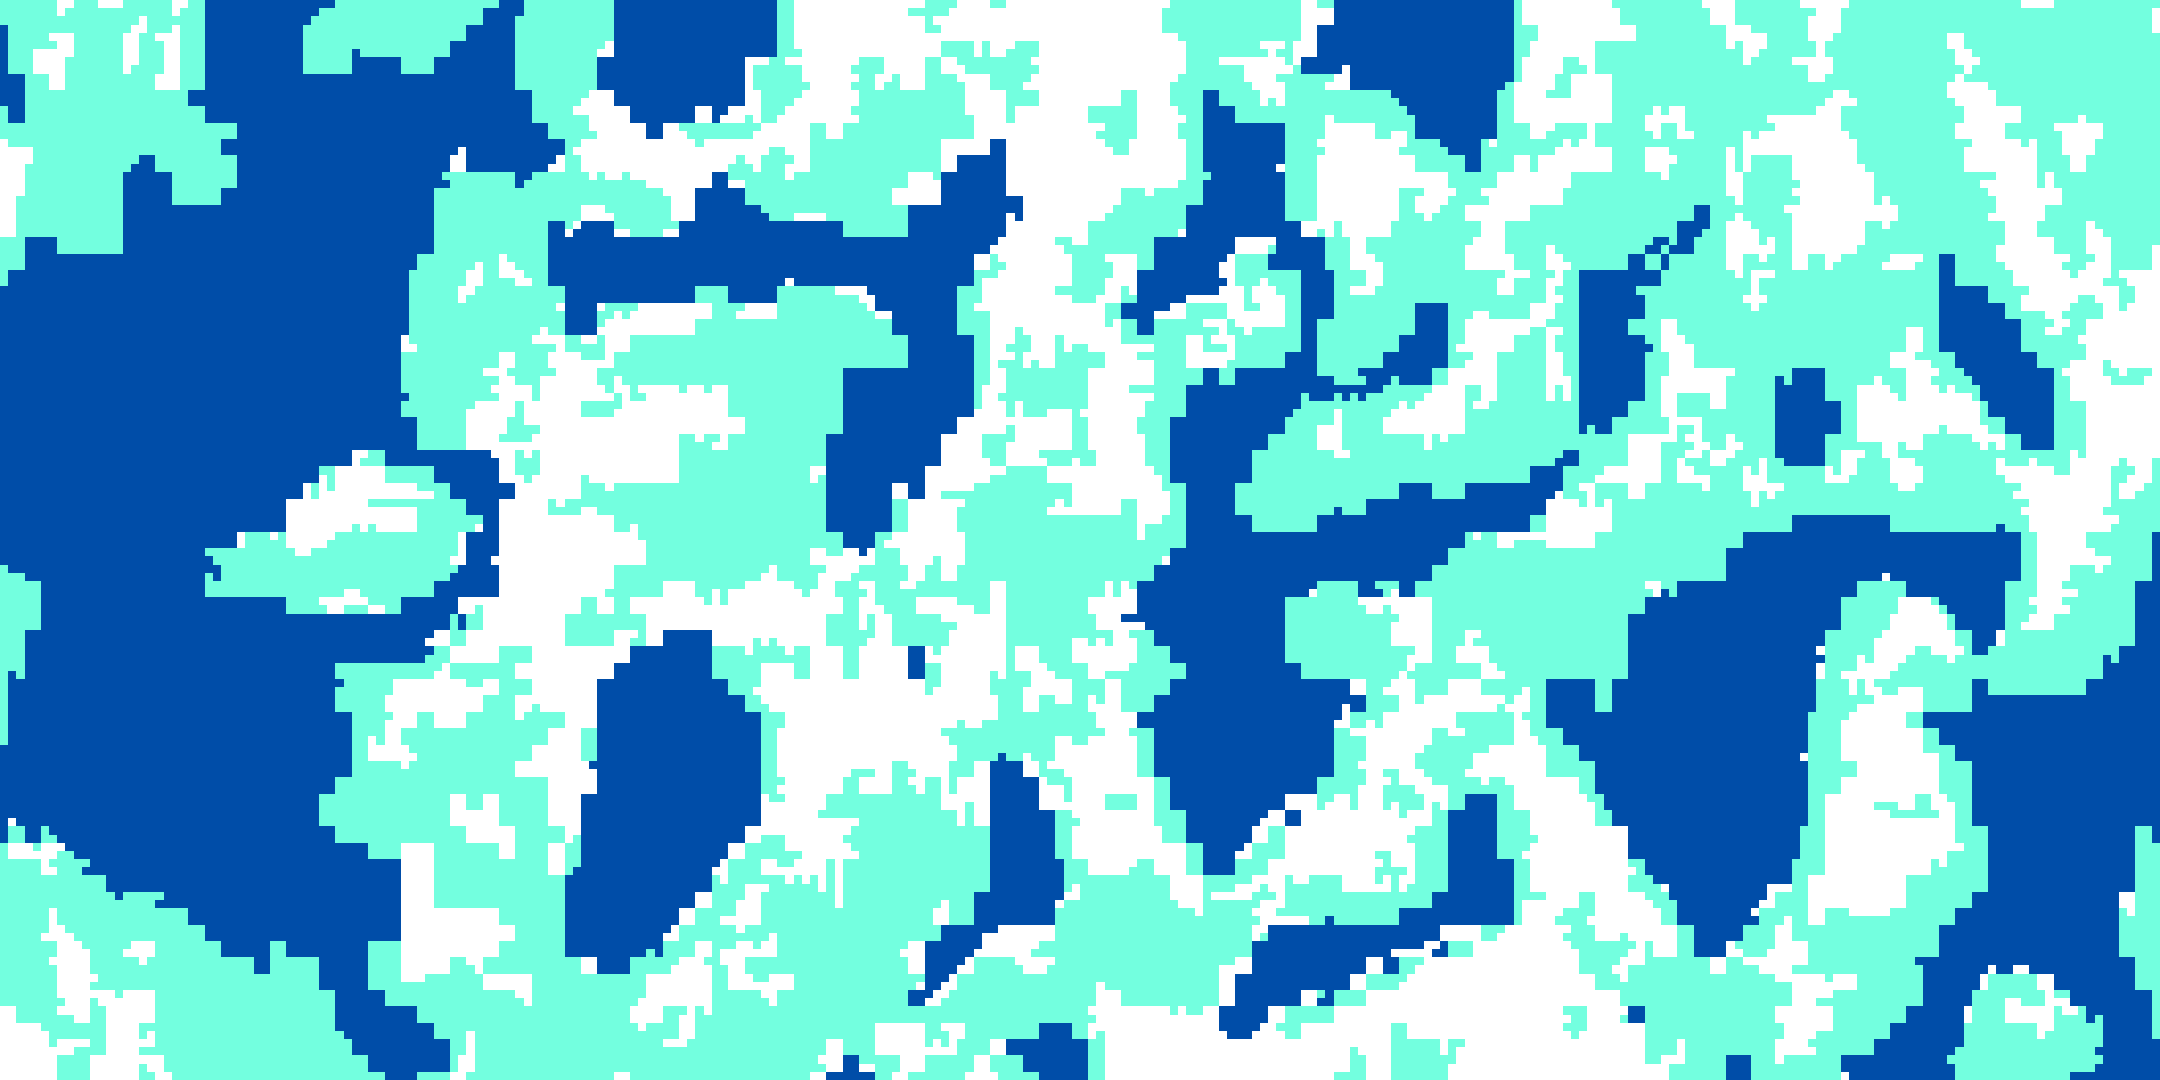
Forest and grass type classification — distinguishing coniferous forest, broadleaved forest, and grassland at pan-European resolution. This layer drives the vegetation rendering: where the data says spruce, the map renders spruce.
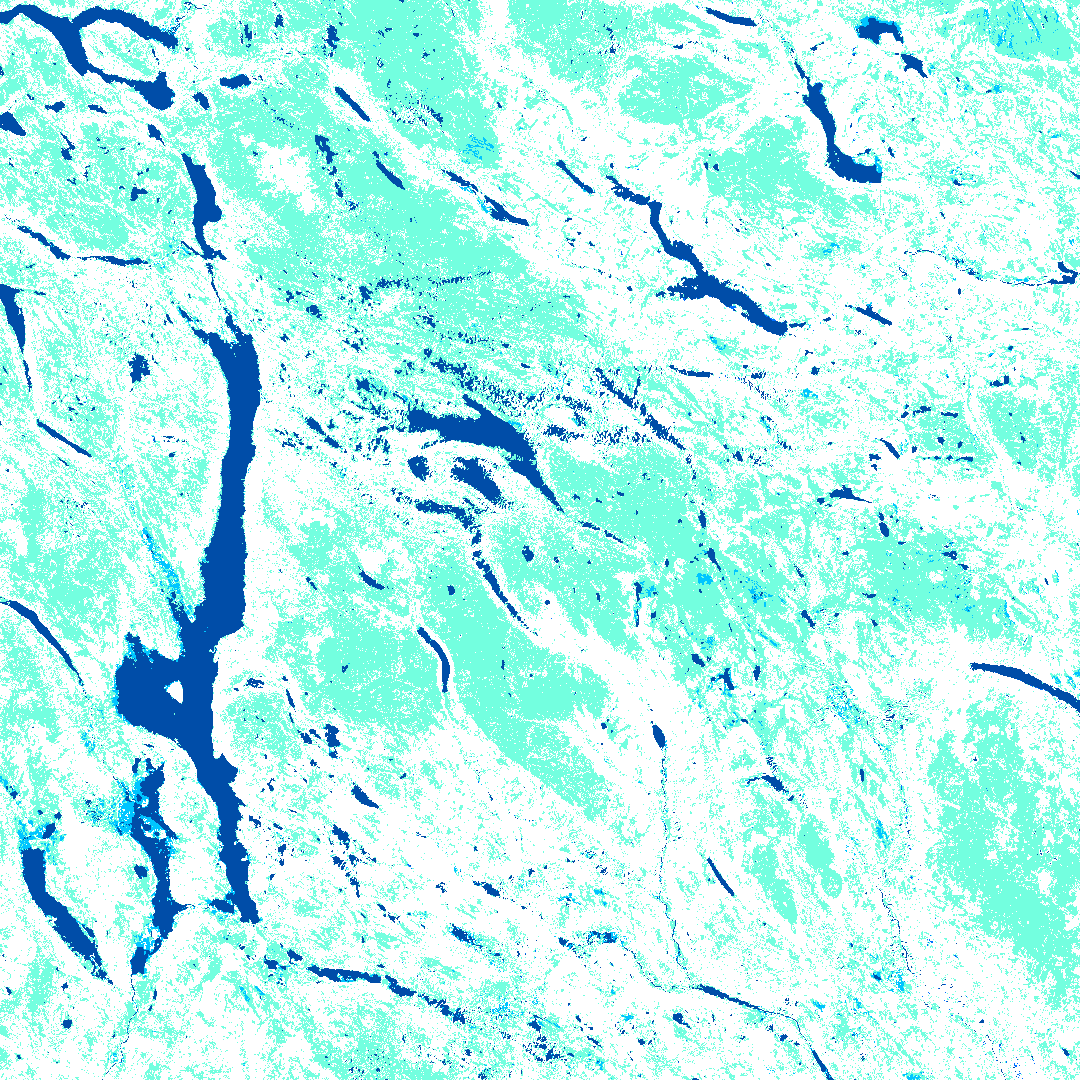
Water type classification — delineating permanent water bodies, seasonal water, and wetland areas. This feeds directly into the hydrological rendering and ensures shoreline accuracy reflects satellite-observed reality, not a designer's approximation.
On top of Copernicus, we applied CORINE Land Cover 2018 (CLC2018) as a broader contextual classification layer, providing standardised land use categories across the full extent of the map area.
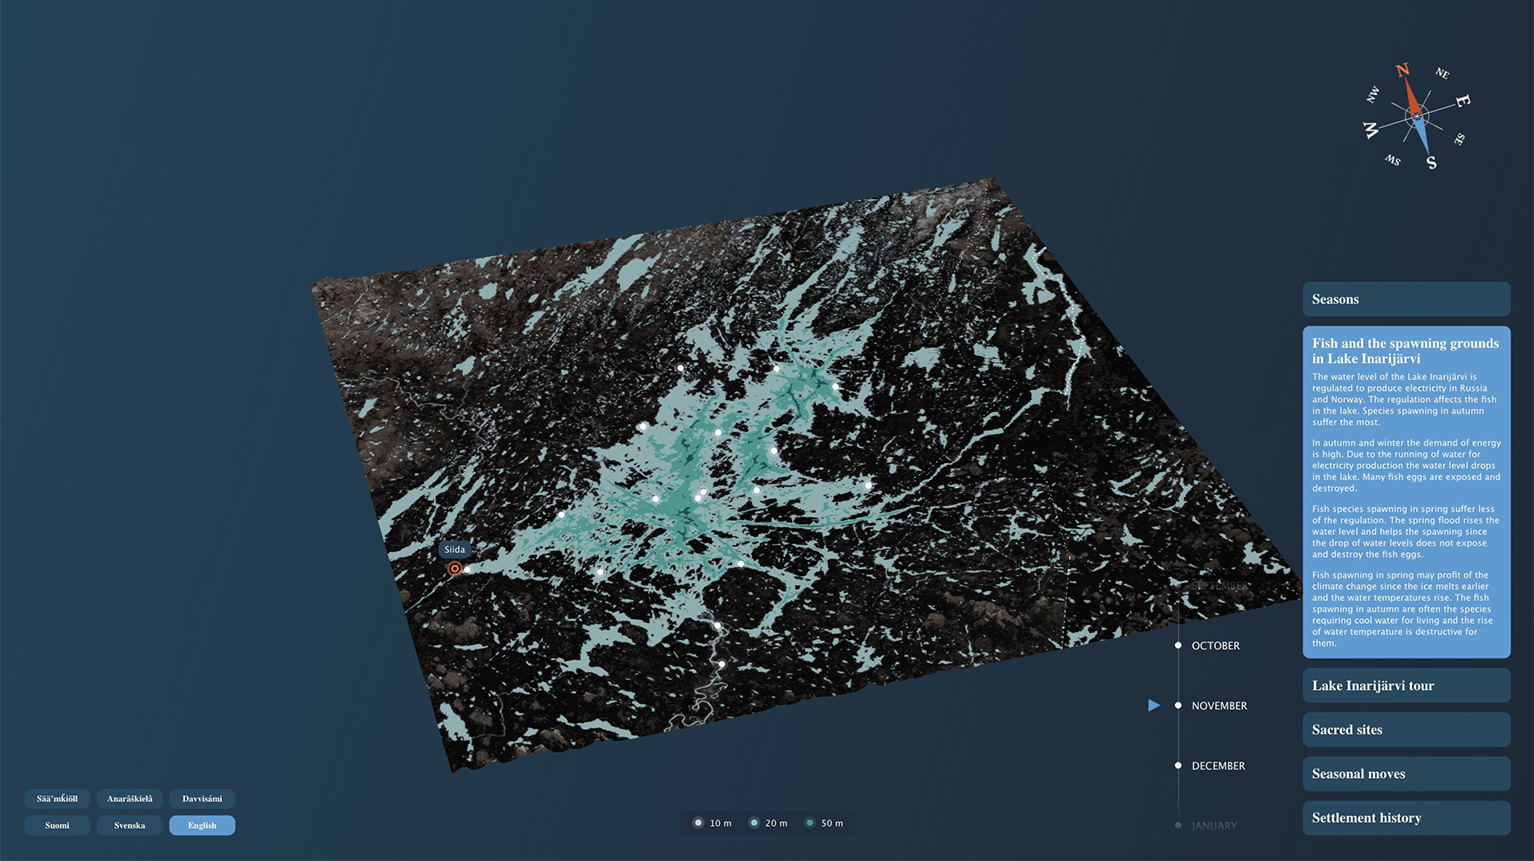
Lake Inari freezes and thaws on an annual cycle, and visualising that cycle required temporal data — not a single snapshot but a series of states across months. SYKE's Tarkka ice observation layer provided satellite-derived snapshots of ice extent at intervals through the winter season. These observations were composited into a timeline showing the progression of freeze-up from autumn through spring melt, all driven by observed data rather than artistic interpretation.
Beyond the physical landscape, the map carries layers of human and ecological information — spawning grounds for Lake Inari's six forms of whitefish, prehistoric residence sites, Sámi holy places, and the annual migration routes of the Inari Sámi tied to seasonal rhythms (movement on Mikkelipäivä in late September, return dependent on ice conditions in June).
These layers were structured as tabular geodata — coordinates, attributes, and metadata managed in spreadsheets and converted to spatial formats — so they integrate into the same pipeline as the raster and vector environmental data. The spawning ground boundaries were digitised directly onto the map coordinate system rather than drawn freehand on a flat illustration.